Minnesota Vikings depth chart, Week 6
The Vikings depth chart for Week 6, ordered by who actually played their last 3 games: QB Kyler Murray (100% of snaps last game); RB Aaron Jones (87% of snaps last game) ahead of Max Bredeson; WR Justin Jefferson, Jauan Jennings and Tai Felton; TE Gavin Bartholomew. Aaron Jones is listed Questionable. Justin Jefferson moved up to WR1 from WR4.
Ordered by the snaps and touches each player got in the Vikings' last 3 games (Weeks 3, 4, 5), the newest counted most. Team charts lag; this one moves the morning after a game. The big number is each player's share of the club's snaps in its last game.
Vikings quarterbacks
- QB1
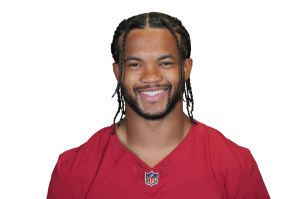
100%
snaps last game
Same
100% weighted - QB2
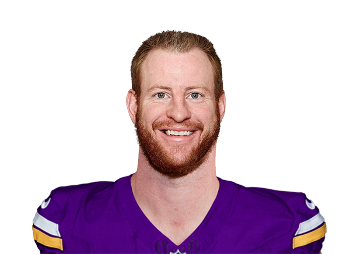
No snaps in the window · team chart QB2
0%
snaps last game
Same
0% weighted - QB3
 Max BrosmerOUTCoach's Decision
No snaps in the window · team chart QB3
0%
snaps last game
Same
0% weighted
Vikings running backs
- RB1
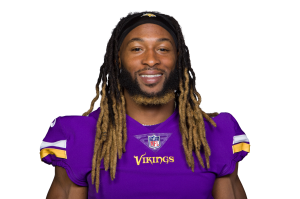 Aaron JonesQUESTIONABLELeg
20.7 carries per game, 5.7 targets per game, 90% of touches · team chart RB1
87%
snaps last game
Same
81% weighted - RB2

0 carries per game, 0 targets per game, 0% of touches · team chart RB4
28%
snaps last game
Up 2
23% weighted - RB3
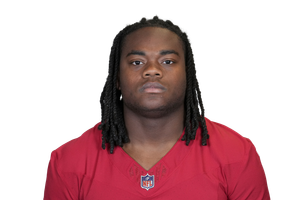
0.3 carries per game, 0.7 targets per game, 3% of touches · team chart RB3
7%
snaps last game
Same
11% weighted - RB4

6%
snaps last game
Down 2
8% weighted
Advertisement
Vikings wide receivers
- WR1
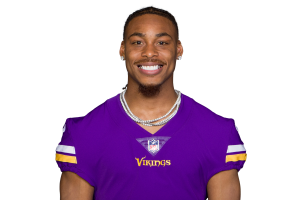
89%
snaps last game
Up 3
46% weighted - WR2

69%
snaps last game
Same
79% weighted - WR3

66%
snaps last game
Same
62% weighted - WR4
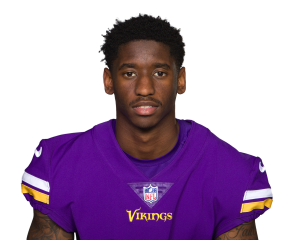
0%
snaps last game
Down 3
48% weighted - WR5

2 targets per game · team chart WR4
20%
snaps last game
Same
15% weighted - WR6
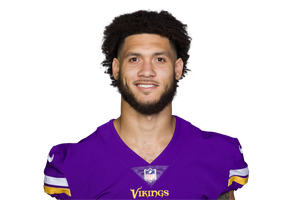
1 targets per game · not on the team chart
9%
snaps last game
New
4% weighted
Vikings tight ends
- TE1

2.3 targets per game · team chart TE2
62%
snaps last game
Up 1
39% weighted - TE2
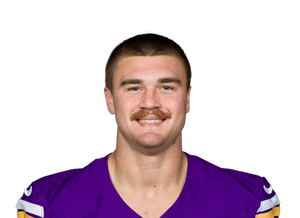
1 targets per game · team chart TE3
55%
snaps last game
New
28% weighted - TE3
3%
snaps last game
Down 2
43% weighted
What changed for Week 6
- Justin Jefferson moved up to WR1 from WR4 (46% of snaps weighted, 89% in the last game).
- Max Bredeson moved up to RB2 from RB4 (23% of snaps weighted, 28% in the last game).
- Gavin Bartholomew moved up to TE1 from TE2 (39% of snaps weighted, 62% in the last game).
- Aaron Jones is listed Questionable (leg); next at RB: Max Bredeson.
On injured reserve or otherwise off the active roster
- RB
No snaps in the window · team chart RB5
0%
snaps last game
0% weighted - TE
0 targets per game · team chart TE4
0%
snaps last game
7% weighted
How this depth chart is ordered
Each slot is ordered by the club's last three games played, a bye skipped: the newest game counts three times, the one before twice, the one before that once.
Quarterbacks, receivers and tight ends are ordered by their weighted share of the club's offensive snaps. Running backs blend that snap share half and half with their share of the backfield's touches (carries plus targets), because a back's snaps include pass protection.
The newest game also counts on its own: a player's place is the higher of his weighted share and his share of that one game, so a starter back from a missed game, or a back who just took the job, is not held under by the games before it.
A game a player missed counts as zero for him. Players with no snaps in the window follow in the club's own listed order, and players on injured reserve, PUP, NFI or a suspension are listed apart.
Vikings snap counts · All 32 depth charts · Injury report · Start or sit · Game day weather
Common questions
Who is the Vikings starting quarterback in Week 6?
Kyler Murray, on 100% of snaps. Carson Wentz is next.
Who is the Vikings RB1?
Aaron Jones, on 81% of snaps and 90% of the backfield's touches over the window, ahead of Max Bredeson (0% of touches).
Who are the Vikings top wide receivers?
Justin Jefferson (46% of snaps, 4.5 targets per game), Jauan Jennings (79% of snaps, 1.3 targets per game), Tai Felton (62% of snaps, 2 targets per game).
Why does this Vikings depth chart differ from the team's?
A team's listed order is a statement of intent and it lags. This one is ordered by the snaps and touches each player actually got in the Vikings' last 3 games, the newest counted most, and the team's own order is printed beside each name.
By the Parlae deskDepth chart updated Oct 14, 2026 at 7:09 PM ETHow this is builtReport a wrong number