NFLDepth chart
D'Andre Swift moves up to RB1 on the Bears depth chart
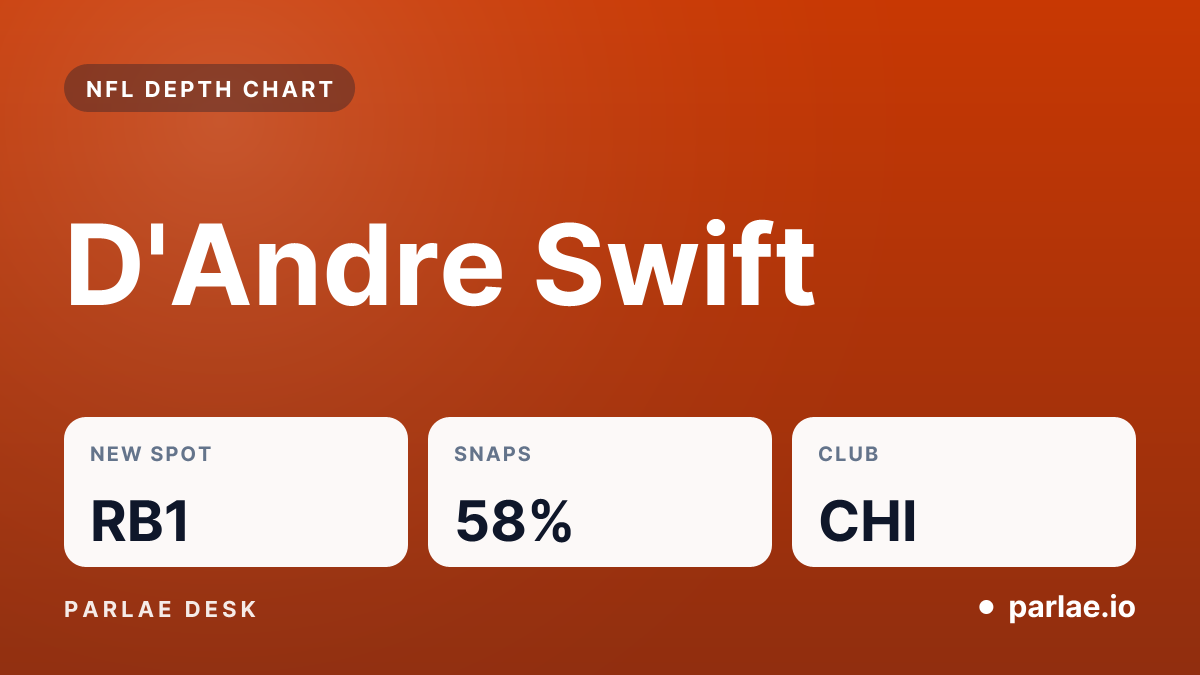
D'Andre Swift is now first among the Chicago Bears running backs on our usage depth chart, after playing 58% of the snaps in the club's latest game, up from RB2.
By the Parlae Desk ·
Key facts
- New spot
- RB1
- Before
- RB2
- Snaps, latest game
- 58%
- Snaps, window
- 52%
- Targets a game
- 3.3
- Carries a game
- 14.7
- Through
- Week 5
What changed
Our usage depth chart now lists D'Andre Swift as the primary running back for the Chicago Bears. This chart tracks snaps and touches over recent games rather than official team listings. Swift previously held the RB2 spot on this chart, though the club officially lists him as RB1.
In the latest game, Swift played 58% of the snaps. Across the window measured by our usage depth chart, he played 52% of the snaps and handled 49% of the touches for the backfield. Through Week 5, Swift is averaging 3.3 targets and 14.7 carries per game.
Advertisement
Who he passed
Roschon Johnson has moved to RB2 on the usage chart, accounting for 23% of snaps across the measured window. These movements typically reflect changes in snap counts first, with production following. The next game will determine if this role remains steady or shifts back.
The rest of the room
Behind Swift and Johnson on the Bears chart is Kyle Monangai, who is listed as RB3 with 23% of snaps across the window. Monangai carries a Questionable designation. Because these rankings are based on snap and touch volume, the order can change quickly based on workload shifts in a single game.
What it means for fantasy
Fantasy production is closely tied to opportunity. A player rising to the top of the usage chart represents the individual with the highest volume of snaps and touches at his position for his team. This volume is a steady predictor of point potential. If Swift is available on the waiver wire, he is worth consideration this week.
The usage chart is updated as new games are played. All shifts in positioning are available on the Chicago Bears depth chart page.
Sources
- Our usage depth chart, built from snap counts and play by play