NFLDepth chart
Jayden Daniels moves up to QB1 on the Commanders depth chart
Jayden Daniels has moved to QB1 on the Washington Commanders usage depth chart after playing 100% of the team's snaps in the most recent game. Daniels previously held the QB3 spot on the chart.
By the Parlae Desk ·
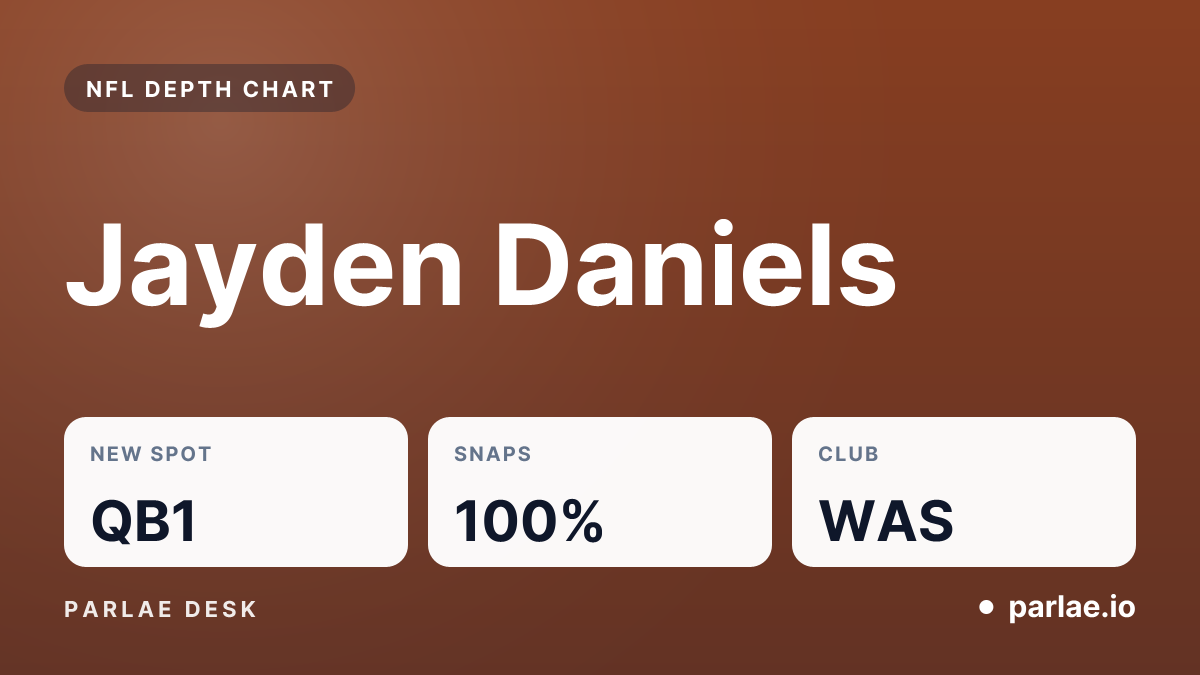
Key facts
- New spot
- QB1
- Before
- QB3
- Snaps, latest game
- 100%
- Snaps, window
- 50%
- Carries a game
- 8
- Through
- Week 5
What changed
The usage depth chart, which ranks players based on snaps and touches in recent games rather than official team listings, now places Jayden Daniels first among Washington Commanders quarterbacks. He was previously ranked as QB3 on this chart. The Commanders official depth chart currently lists him as QB1.
Daniels played 100% of the snaps in the latest game and 50% across the weighted window used for the chart. Through Week 5, he is averaging 8 carries a game and has played in 1 of the last 3 games, per our usage depth chart built from snap counts and play by play.
Advertisement
Who he passed
Athan Kaliakmanis is now ranked as QB2, having played 28% of snaps across the window. This shift tracks changes in snap counts first and production second, meaning the role will either hold or change based on the next game, per our usage depth chart built from snap counts and play by play.
The rest of the room
Marcus Mariota follows on the Commanders chart at QB3 with 22% of snaps across the window. Mariota is officially listed as Doubtful. The usage order is determined by snaps and touches, allowing a player to rise in the rankings in a single game when the workload shifts.
What it means for fantasy
A change at starting quarterback impacts every pass catcher on the roster, as target totals typically follow the volume of the new passer. It is important to review the status of the team's receivers and tight ends on their respective pages before finalizing a lineup.
The depth chart updates as new games are completed. Every movement is tracked on the Washington Commanders depth chart page.
Sources
- Our usage depth chart, built from snap counts and play by play