NFL snap counts, Week 9
Every club's Week 9 snap counts with snap share, target share and air yards share at every position. Computed from the play-by-play and the official snap counts, not copied from anyone's chart.
Snap counts are still filling in for BUF, MIN.
- Cade Otton and Brock Bowers each played 100% of their club's offensive snaps, tied for the highest share of any tight end.
- CeeDee Lamb drew 47% of the Cowboys' targets, the highest share in Week 9.
- Adonai Mitchell accounted for 79% of the Jets' air yards, the highest share among pass catchers.
- Tyler Allgeier handled 94% of the Cardinals' carries, the highest share of any running back.
- Ollie Gordon II had 4 red zone targets and carries, 80% of the Dolphins' red zone plays, the top share with three or more.
Usage by position
| Player | ||||||||||
|---|---|---|---|---|---|---|---|---|---|---|
1 Ryan FlournoyDAL vs IND | 98% | 9% | 12% | 17.0 | 0.22 | 0.04 | 10% | 15% | 3 | 53 |
2 Drake LondonATL vs CIN | 97% | 19% | 18% | 7.6 | 0.40 | 0.08 | 0% | 14% | 5 | 68 |
3 CeeDee LambDAL vs IND | 94% | 47% | 60% | 15.6 | 1.13 | 0.22 | 20% | 54% | 16 | 195 |
4 Puka NacuaLAR vs WAS | 93% | 46% | 55% | 8.9 | 1.08 | 0.27 | 8% | 40% | 19 | 150 |
5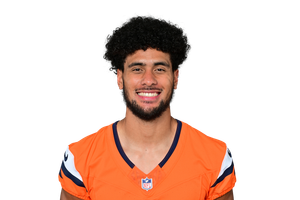 Devaughn VeleNO vs CLE | 93% | 13% | 11% | 10.3 | 0.26 | 0.06 | 0% | 14% | 4 | 17 |
6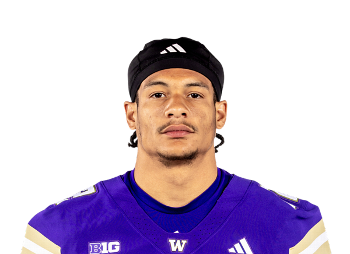 Denzel BostonCLE vs NO | 93% | 24% | 36% | 10.0 | 0.61 | 0.10 | 13% | 50% | 7 | 98 |
7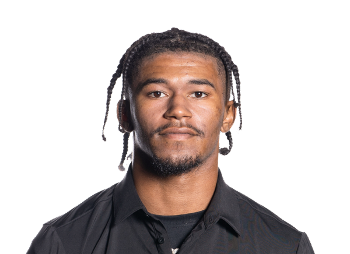 KC Concepcion Jr.CLE vs NO | 93% | 21% | 33% | 10.5 | 0.54 | 0.09 | 13% | 0% | 6 | 85 |
8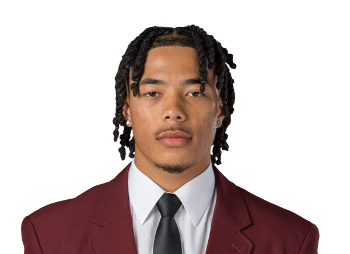 Makai LemonPHI vs NYG | 93% | 27% | 29% | 8.6 | 0.61 | 0.14 | 0% | 25% | 9 | 61 |
9 Darius CooperPHI vs NYG | 93% | 24% | 43% | 14.0 | 0.66 | 0.12 | 0% | 50% | 8 | 25 |
10 Chris Godwin Jr.TB vs CHI | 91% | 10% | 10% | 9.0 | 0.22 | 0.05 | 0% | 22% | 3 | 16 |
11 Adonai MitchellNYJ vs KC | 89% | 23% | 79% | 18.0 | 0.91 | 0.13 | 40% | 38% | 7 | 0 |
12 Omar Cooper Jr.NYJ vs KC | 86% | 37% | 13% | 1.9 | 0.64 | 0.20 | 0% | 50% | 11 | 58 |
13 Chris OlaveNO vs CLE | 85% | 38% | 60% | 19.1 | 0.98 | 0.19 | 0% | 29% | 12 | 98 |
14 Courtland SuttonDEN vs CAR | 85% | 27% | 42% | 11.7 | 0.69 | 0.14 | 15% | 17% | 9 | 45 |
15 Ja'Marr ChaseCIN vs ATL | 84% | 43% | 55% | 8.6 | 1.02 | 0.25 | 43% | 71% | 12 | 155 |
16 Antonio WilliamsWAS vs LAR | 84% | 18% | 24% | 10.0 | 0.43 | 0.12 | 0% | 20% | 6 | 25 |
17 Jahan DotsonATL vs CIN | 84% | 7% | 6% | 6.0 | 0.15 | 0.04 | 8% | 0% | 2 | 16 |
18 Rome OdunzeCHI vs TB | 84% | 21% | 26% | 13.6 | 0.49 | 0.14 | 25% | 33% | 7 | 60 |
19 Malachi FieldsNYG vs PHI | 84% | 19% | 23% | 12.2 | 0.44 | 0.09 | 20% | 10% | 5 | 40 |
20 Tre' HarrisLAC vs HOU | 83% | 23% | 25% | 10.7 | 0.52 | 0.12 | 13% | 18% | 7 | 6 |
21 Quentin JohnstonLAC vs HOU | 83% | 13% | 30% | 22.8 | 0.41 | 0.07 | 0% | 27% | 4 | 58 |
22 Jameson WilliamsDET vs MIA | 83% | 8% | 29% | 23.0 | 0.33 | 0.04 | 0% | 14% | 2 | 31 |
23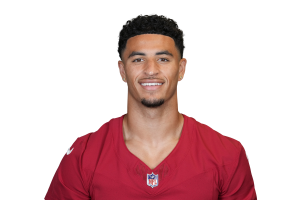 Michael WilsonARI vs SEA | 83% | 24% | 13% | 3.7 | 0.45 | 0.16 | 30% | 29% | 7 | 60 |
24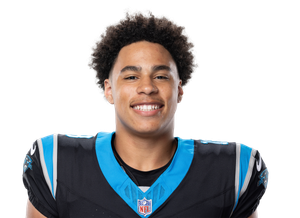 Jalen CokerCAR vs DEN | 82% | 14% | 13% | 8.0 | 0.30 | 0.09 | 13% | 0% | 5 | 29 |
25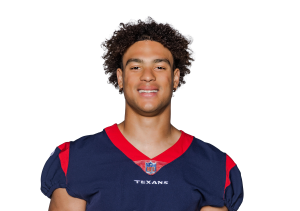 Xavier HutchinsonHOU vs LAC | 81% | 14% | 15% | 13.2 | 0.31 | 0.09 | 10% | 27% | 5 | 29 |
26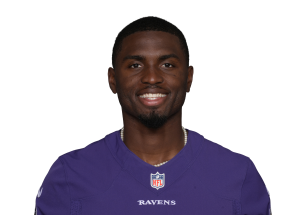 Laquon TreadwellIND vs DAL | 81% | 3% | 2% | 4.0 | 0.06 | 0.02 | 0% | 11% | 1 | 0 |
27 Tetairoa McMillanCAR vs DEN | 80% | 16% | 30% | 14.8 | 0.45 | 0.11 | 13% | 13% | 6 | 56 |
28 Tez JohnsonTB vs CHI | 79% | 17% | 37% | 20.2 | 0.51 | 0.09 | 0% | 22% | 5 | 76 |
29 Malik NabersNYG vs PHI | 79% | 30% | 30% | 10.3 | 0.66 | 0.15 | 20% | 40% | 8 | 43 |
30 Kyle WilliamsNE vs GB | 78% | 6% | 19% | 41.5 | 0.22 | 0.04 | 0% | 17% | 2 | 0 |
31 Christian WatsonGB vs NE | 77% | 30% | 50% | 23.8 | 0.79 | 0.16 | 0% | 33% | 8 | 171 |
32 Malik WashingtonMIA vs DET | 77% | 14% | 16% | 12.7 | 0.32 | 0.07 | 20% | 14% | 3 | 21 |
33 Jordan WatkinsSF vs LV | 77% | 17% | 30% | 17.5 | 0.47 | 0.07 | 0% | 14% | 4 | 86 |
34 Josh DownsIND vs DAL | 77% | 19% | 7% | 2.8 | 0.33 | 0.12 | 0% | 22% | 6 | 24 |
35 Emeka EgbukaTB vs CHI | 77% | 17% | 25% | 13.6 | 0.42 | 0.10 | 7% | 22% | 5 | 38 |
36 Jaxon Smith-NjigbaSEA vs ARI | 76% | 36% | 39% | 6.1 | 0.81 | 0.20 | 0% | 25% | 10 | 51 |
37 Amon-Ra St. BrownDET vs MIA | 75% | 40% | 52% | 8.2 | 0.97 | 0.23 | 17% | 43% | 10 | 86 |
38 Matthew GoldenGB vs NE | 74% | 37% | 31% | 12.0 | 0.77 | 0.20 | 15% | 17% | 10 | 164 |
39 Xavier WorthyKC vs NYJ | 74% | 21% | 15% | 2.8 | 0.42 | 0.12 | 15% | 0% | 6 | 48 |
40 Jalen NailorLV vs SF | 74% | 13% | 17% | 10.3 | 0.30 | 0.11 | 0% | 0% | 4 | 9 |
41 Caleb DouglasMIA vs DET | 74% | 38% | 40% | 12.3 | 0.85 | 0.19 | 0% | 29% | 8 | 70 |
42 Cooper KuppSEA vs ARI | 73% | 14% | 14% | 5.5 | 0.31 | 0.08 | 0% | 25% | 4 | 32 |
43 Nico CollinsHOU vs LAC | 73% | 11% | 8% | 8.3 | 0.22 | 0.08 | 10% | 9% | 4 | 55 |
44 Kalif RaymondCHI vs TB | 71% | 21% | 17% | 8.7 | 0.42 | 0.16 | 13% | 22% | 7 | 32 |
45 Jerry JeudyCLE vs NO | 69% | 14% | 31% | 15.3 | 0.43 | 0.08 | 0% | 17% | 4 | 37 |
46 Tee HigginsCIN vs ATL | 68% | 21% | 22% | 7.0 | 0.48 | 0.15 | 29% | 29% | 6 | 32 |
47 DeMario DouglasNE vs GB | 68% | 25% | 26% | 12.3 | 0.56 | 0.21 | 0% | 17% | 9 | 102 |
48 Mack HollinsNE vs GB | 68% | 17% | 20% | 14.0 | 0.39 | 0.14 | 25% | 0% | 6 | 36 |
49 Pat BryantDEN vs CAR | 68% | 15% | 18% | 8.8 | 0.34 | 0.10 | 8% | 33% | 5 | 56 |
50 Parker WashingtonJAX vs BAL | 68% | 27% | 31% | 8.7 | 0.62 | 0.18 | 18% | 33% | 7 | 61 |
51 Jakobi MeyersJAX vs BAL | 68% | 23% | 33% | 11.0 | 0.58 | 0.16 | 9% | 11% | 6 | 65 |
52 Zay FlowersBAL vs JAX | 66% | 38% | 27% | 1.5 | 0.75 | 0.16 | - | 33% | 6 | 6 |
53 Tre TuckerLV vs SF | 64% | 25% | 52% | 16.0 | 0.74 | 0.25 | 25% | 14% | 8 | 55 |
54 Rashod BatemanBAL vs JAX | 63% | 13% | 29% | 5.0 | 0.39 | 0.06 | - | 0% | 2 | 6 |
55 Stefon DiggsWAS vs LAR | 61% | 15% | 24% | 12.2 | 0.39 | 0.13 | 0% | 0% | 5 | 51 |
56 Tory HortonSEA vs ARI | 61% | 11% | 15% | 7.7 | 0.26 | 0.07 | 0% | 13% | 3 | 22 |
57 Van JeffersonWAS vs LAR | 58% | 21% | 34% | 12.3 | 0.55 | 0.19 | 100% | 30% | 7 | 58 |
58 Rashee RiceKC vs NYJ | 58% | 24% | 4% | 0.7 | 0.39 | 0.18 | 0% | 14% | 7 | 49 |
59 Keenan AllenIND vs DAL | 56% | 25% | 39% | 12.1 | 0.65 | 0.22 | 14% | 22% | 8 | 26 |
60 Luther Burden IIICHI vs TB | 56% | 27% | 15% | 6.0 | 0.50 | 0.27 | 0% | 33% | 9 | 97 |
61 KeAndre Lambert-SmithLAC vs HOU | 56% | 13% | 26% | 20.0 | 0.38 | 0.10 | 13% | 18% | 4 | 50 |
62 Darnell MooneyNYG vs PHI | 55% | 15% | 22% | 15.0 | 0.38 | 0.11 | 0% | 10% | 4 | 54 |
63 Demarcus RobinsonSF vs LV | 51% | 17% | 15% | 8.8 | 0.37 | 0.11 | 8% | 14% | 4 | 22 |
64 Tank DellHOU vs LAC | 47% | 24% | 33% | 15.4 | 0.59 | 0.27 | 10% | 9% | 9 | 105 |
More
How these are counted
Target share is a player's targets over his club's targets. Air yards share counts every pass attempt's air yards, caught or not. WOPR is 1.5 times target share plus 0.7 times air yards share. Red zone plays start at the opponent's 20, goal line plays at the 5. Snap share is offensive snaps over the club's offensive snaps.
Route participation, targets per route run and yards per route run are not here. They need who was on the field for every dropback, and the public feed publishes that only after the season. We print targets per snap instead of guessing routes.
Play-by-play from nflverse (nflfastR), CC BY 4.0. Snap counts from Sleeper.
By the Parlae deskSnap counts updated Nov 10, 2026 at 12:08 PM ETHow this is builtReport a wrong number
checked 5 hours ago