Board updated , from the latest box scores and injury reports.
8-cat fantasy basketball rankings 2026-27
The top 200 for 8-category leagues, the nine standard categories without turnovers. Nikola Jokić leads at +13.1 across the eight. Ja Morant gains the most in the top 100, No. 147 in 9-cat to No. 68 here. Ranks are our board's order from real box scores, not ADP.
8-cat. Valued on 8 categories: PTS, REB, AST, STL, BLK, 3PM, FG%, FT% (head-to-head: per game).
Who climbs without turnovers
- #147 to #68, 3.5 TO/G
 Ja MorantPG/SGPOR
- #149 to #78, 3.2 TO/G
 Stephon CastleSG/PGSAS
- #156 to #87, 2.9 TO/G
 Shaedon SharpeSG/PGPOROUT
- #111 to #64, 3.1 TO/G
 Paolo BancheroPFORL
- #99 to #61, 2.9 TO/G
 Darius GarlandPGLAC
- #125 to #89, 2.4 TO/G
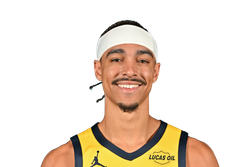 Andrew NembhardPG/SGIND
- #101 to #66, 2.8 TO/G
 Jrue HolidayPG/SGPORDTD
- #67 to #35, 3.8 TO/G
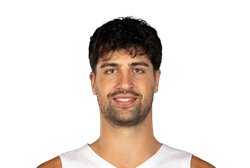 Deni AvdijaPF/SG/SFPOR
- #115 to #83, 2.5 TO/G
 Jusuf NurkićCUTAOUT
- #130 to #98, 2.3 TO/G
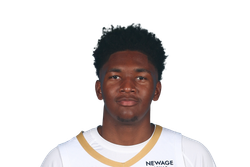 Derik QueenC/PFNOP
Advertisement
The 8-cat board
| # | Rd | Player | PTS | REB | AST | STL | BLK | 3PM | FG% | FT% | Value | 9-cat |
|---|---|---|---|---|---|---|---|---|---|---|---|---|
| 1 | 1.01 |  Nikola Jokić CDEN | 27.7 | 12.9 | 10.7 | 1.4 | 0.8 | 1.7 | 56.9% | 83.1% | +13.1 | #1 |
| 2 | 1.02 | 25.0 | 11.5 | 3.1 | 1.0 | 3.1 | 1.9 | 51.2% | 82.7% | +10.3 | #2 | |
| 3 | 1.03 |  Luka Dončić PGLAL | 33.5 | 7.7 | 8.3 | 1.6 | 0.5 | 4.0 | 47.6% | 78.0% | +9.1 | #6 |
| 4 | 1.04 | 31.1 | 4.3 | 6.6 | 1.4 | 0.8 | 1.7 | 55.3% | 87.9% | +8.9 | #3 | |
| 5 | 1.05 | 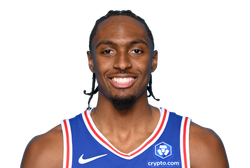 Tyrese Maxey PGPHI | 28.3 | 4.1 | 6.6 | 1.9 | 0.8 | 3.1 | 46.2% | 89.2% | +7.8 | #5 |
| 6 | 1.06 |  Kawhi Leonard SF/SGTOR | 27.9 | 6.4 | 3.6 | 1.9 | 0.4 | 2.6 | 50.5% | 89.2% | +7.5 | #4 |
| 7 | 1.07 |  Donovan Mitchell SG/PGCLE | 27.9 | 4.5 | 5.7 | 1.5 | 0.3 | 3.2 | 48.3% | 86.5% | +5.7 | #7 |
| 8 | 1.08 |  Cade Cunningham PGDET | 23.9 | 5.5 | 9.9 | 1.4 | 0.8 | 2.0 | 46.1% | 81.2% | +5.6 | #16 |
| 9 | 1.09 |  Stephen Curry PGGSWDTD | 26.6 | 3.6 | 4.7 | 1.1 | 0.4 | 4.4 | 46.8% | 92.3% | +5.3 | #10 |
| 10 | 1.10 |  Jalen Johnson PF/SFATL | 22.5 | 10.3 | 7.9 | 1.2 | 0.4 | 1.7 | 48.9% | 78.8% | +5.1 | #17 |
| 11 | 1.11 |  Kevin Durant SF/PFHOU | 26.0 | 5.5 | 4.8 | 0.8 | 0.9 | 2.4 | 52.0% | 87.4% | +4.9 | #15 |
| 12 | 1.12 | 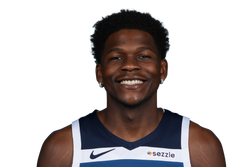 Anthony Edwards SG/PGMIN | 28.8 | 5.0 | 3.7 | 1.4 | 0.8 | 3.4 | 48.9% | 79.6% | +4.8 | #13 |
| 13 | 2.01 | 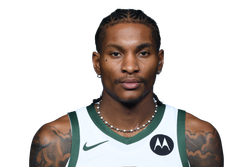 Kevin Porter PG/SGMIL | 17.4 | 5.2 | 7.4 | 2.2 | 0.5 | 1.2 | 46.5% | 87.8% | +4.7 | #14 |
| 14 | 2.02 | 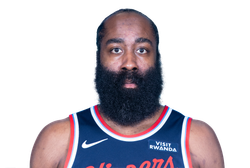 James Harden PGCLE | 23.6 | 4.8 | 8.0 | 1.1 | 0.4 | 3.1 | 43.4% | 88.4% | +4.7 | #23 |
| 15 | 2.03 | 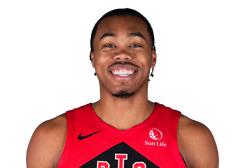 Scottie Barnes PF/SFTOR | 18.1 | 7.5 | 5.9 | 1.4 | 1.4 | 0.8 | 50.7% | 81.5% | +4.6 | #12 |
| 16 | 2.04 | 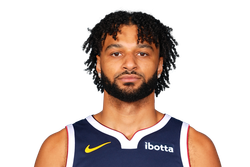 Jamal Murray PGDEN | 25.4 | 4.4 | 7.1 | 0.9 | 0.4 | 3.3 | 48.3% | 88.7% | +4.6 | #9 |
| 17 | 2.05 | 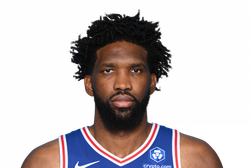 Joel Embiid CPHI | 26.9 | 7.7 | 3.9 | 0.6 | 1.2 | 1.4 | 48.9% | 85.4% | +3.8 | #22 |
| 18 | 2.06 |  Trey Murphy SG/SFNOP | 21.5 | 5.7 | 3.8 | 1.5 | 0.4 | 3.2 | 47.0% | 88.6% | +3.8 | #11 |
| 19 | 2.07 |  Lauri Markkanen PF/SFUTA | 26.7 | 6.9 | 2.1 | 1.0 | 0.5 | 2.7 | 47.7% | 89.6% | +3.8 | #8 |
| 20 | 2.08 |  Austin Reaves SG/PGLAL | 23.3 | 4.7 | 5.5 | 1.1 | 0.4 | 2.3 | 49.0% | 87.1% | +3.5 | #24 |
| 21 | 2.09 | 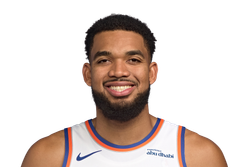 Karl-Anthony Towns C/PFNYK | 20.1 | 11.9 | 3.0 | 0.9 | 0.5 | 1.5 | 50.1% | 85.8% | +3.3 | #21 |
| 22 | 2.10 | 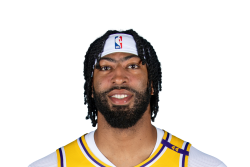 Anthony Davis C/PFWAS | 20.4 | 11.1 | 2.8 | 1.1 | 1.6 | 0.5 | 50.6% | 72.8% | +3.2 | #19 |
| 23 | 2.11 | 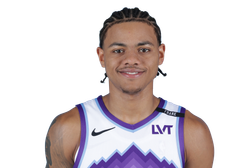 Keyonte George PG/SGUTA | 23.6 | 3.7 | 6.1 | 1.1 | 0.3 | 2.5 | 45.6% | 89.2% | +2.8 | #36 |
| 24 | 2.12 | 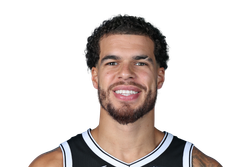 Michael Porter SF/PFBKN | 24.2 | 7.1 | 3.0 | 1.1 | 0.3 | 3.4 | 46.3% | 85.9% | +2.7 | #25 |
| 25 | 3.01 |  Jaylen Brown SF/SG/PFPHI | 28.7 | 6.9 | 5.1 | 1.0 | 0.4 | 2.0 | 47.7% | 79.5% | +2.6 | #56 |
| 26 | 3.02 |  Jimmy Butler SF/SG/PFGSWOUT | 20.0 | 5.6 | 4.9 | 1.4 | 0.2 | 0.8 | 51.9% | 86.4% | +2.5 | #20 |
| 27 | 3.03 |  Chet Holmgren C/PFOKCDTD | 17.1 | 8.9 | 1.7 | 0.6 | 1.9 | 1.3 | 55.7% | 79.2% | +2.5 | #18 |
| 28 | 3.04 | 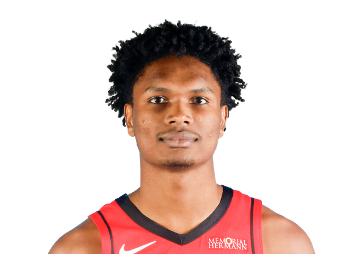 Amen Thompson SG/PG/SFHOU | 18.3 | 7.8 | 5.3 | 1.5 | 0.6 | 0.3 | 53.4% | 77.9% | +2.5 | #28 |
| 29 | 3.05 |  Alperen Şengün C/PFHOU | 20.4 | 8.9 | 6.2 | 1.2 | 1.1 | 0.6 | 51.9% | 69.1% | +2.4 | #42 |
| 30 | 3.06 |  Josh Giddey PGCHI | 17.0 | 8.3 | 9.1 | 1.0 | 0.5 | 1.9 | 44.8% | 76.3% | +2.4 | #60 |
| 31 | 3.07 |  Nickeil Alexander-Walker SG/PGATL | 20.8 | 3.4 | 3.7 | 1.3 | 0.5 | 3.2 | 45.9% | 90.2% | +2.3 | #26 |
| 32 | 3.08 |  LaMelo Ball PGMIN | 20.1 | 4.8 | 7.1 | 1.2 | 0.2 | 3.8 | 40.7% | 89.9% | +2.2 | #40 |
| 33 | 3.09 |  LeBron James PF/PG/SFPHI | 20.9 | 6.1 | 7.2 | 1.2 | 0.6 | 1.3 | 51.5% | 73.7% | +2.2 | #43 |
| 34 | 3.10 | 27.6 | 9.8 | 5.4 | 0.9 | 0.7 | 0.4 | 62.4% | 65.0% | +2.1 | #50 | |
| 35 | 3.11 | Deni Avdija PF/SG/SFPOR | 24.2 | 6.9 | 6.7 | 0.8 | 0.6 | 1.9 | 46.2% | 80.2% | +2.1 | #67 |
| 36 | 3.12 |  Cooper Flagg SG/PG/SFDAL | 21.0 | 6.7 | 4.5 | 1.2 | 0.9 | 1.0 | 46.8% | 82.7% | +1.8 | #35 |
| 37 | 4.01 |  Ryan Rollins PGMIL | 17.3 | 4.6 | 5.6 | 1.5 | 0.4 | 2.5 | 47.2% | 79.6% | +1.8 | #47 |
| 38 | 4.02 | 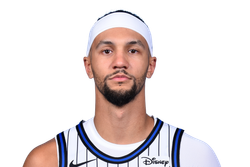 Jalen Suggs PGORL | 13.8 | 3.9 | 5.5 | 1.8 | 0.7 | 2.1 | 43.5% | 85.5% | +1.8 | #46 |
| 39 | 4.03 |  Jalen Duren CDET | 19.5 | 10.5 | 2.0 | 0.8 | 0.8 | 0.0 | 65.0% | 74.7% | +1.7 | #27 |
| 40 | 4.04 |  Devin Booker SG/PGPHX | 26.1 | 3.9 | 6.0 | 0.8 | 0.3 | 1.9 | 45.6% | 87.3% | +1.7 | #63 |
| 41 | 4.05 |  Derrick White SG/PGBOS | 16.5 | 4.4 | 5.4 | 1.1 | 1.3 | 2.7 | 39.4% | 90.2% | +1.5 | #29 |
| 42 | 4.06 |  OG Anunoby PF/SFNYK | 16.7 | 5.2 | 2.2 | 1.6 | 0.7 | 2.3 | 48.4% | 82.8% | +1.5 | #31 |
| 43 | 4.07 |  Paul George SF/SG/PFBOS | 17.3 | 5.3 | 3.6 | 1.7 | 0.4 | 2.7 | 43.9% | 82.0% | +1.4 | #33 |
| 44 | 4.08 |  Desmond Bane SG/PGORL | 20.1 | 4.1 | 4.1 | 1.0 | 0.5 | 2.0 | 48.4% | 90.8% | +1.4 | #37 |
| 45 | 4.09 |  Jalen Brunson PGNYK | 26.0 | 3.3 | 6.8 | 0.8 | 0.1 | 2.6 | 46.7% | 84.1% | +1.3 | #49 |
| 46 | 4.10 |  Bam Adebayo C/PFMIADTD | 20.1 | 10.0 | 3.2 | 1.2 | 0.7 | 1.7 | 44.2% | 77.8% | +1.2 | #32 |
| 47 | 4.11 |  Jaren Jackson C/PFUTA | 19.4 | 5.7 | 2.0 | 1.1 | 1.4 | 1.8 | 47.6% | 80.3% | +1.2 | #44 |
| 48 | 4.12 |  Brandon Miller SF/SG/PFCHA | 20.2 | 4.9 | 3.3 | 1.0 | 0.7 | 3.1 | 43.5% | 89.2% | +1.2 | #53 |
| 49 | 5.01 |  Onyeka Okongwu CATL | 15.2 | 7.6 | 3.1 | 1.1 | 1.1 | 1.9 | 48.0% | 75.7% | +1.0 | #34 |
| 50 | 5.02 |  Dyson Daniels SG/SFATL | 11.9 | 6.8 | 5.9 | 2.0 | 0.4 | 0.3 | 51.7% | 61.5% | +0.9 | #39 |
| 51 | 5.03 |  Evan Mobley C/PFCLE | 18.2 | 9.0 | 3.6 | 0.7 | 1.7 | 1.0 | 54.6% | 60.6% | +0.8 | #41 |
| 52 | 5.04 |  Tyler Herro SG/PGMIL | 20.5 | 4.8 | 4.1 | 0.7 | 0.4 | 2.5 | 48.0% | 91.7% | +0.7 | #48 |
| 53 | 5.05 |  Julius Randle PF/CBKN | 21.1 | 6.7 | 5.0 | 1.1 | 0.2 | 1.4 | 48.1% | 80.2% | +0.7 | #68 |
| 54 | 5.06 |  Donovan Clingan CPOR | 12.1 | 11.6 | 2.1 | 0.6 | 1.7 | 1.1 | 52.0% | 68.0% | +0.6 | #30 |
| 55 | 5.07 |  Alex Sarr C/PFWAS | 16.3 | 7.4 | 2.7 | 0.8 | 2.0 | 1.0 | 48.2% | 69.2% | +0.4 | #45 |
| 56 | 5.08 |  VJ Edgecombe SG/PGPHI | 16.0 | 5.6 | 4.2 | 1.4 | 0.5 | 2.0 | 43.8% | 81.8% | +0.2 | #54 |
| 57 | 5.09 |  Brandon Ingram SF/SG/PFLACOUT | 21.5 | 5.6 | 3.7 | 0.8 | 0.7 | 1.8 | 47.7% | 82.0% | +0.1 | #78 |
| 58 | 5.10 |  Kon Knueppel SG/SFCHADTD | 18.5 | 5.3 | 3.4 | 0.7 | 0.2 | 3.4 | 47.5% | 86.3% | +0.1 | #62 |
| 59 | 5.11 |  De'Aaron Fox PGSAS | 18.6 | 3.8 | 6.2 | 1.2 | 0.3 | 1.8 | 48.6% | 76.0% | +0.1 | #71 |
| 60 | 5.12 |  Mikal Bridges SF/SG/PFNYK | 14.4 | 3.8 | 3.7 | 1.3 | 0.8 | 1.9 | 49.0% | 82.7% | +0.0 | #38 |
| 61 | 6.01 | Darius Garland PGLAC | 18.8 | 2.4 | 6.7 | 1.0 | 0.2 | 2.7 | 46.0% | 86.1% | +0.0 | #99 |
| 62 | 6.02 |  Immanuel Quickley PG/SGTOR | 16.4 | 4.0 | 5.9 | 1.3 | 0.1 | 2.5 | 44.3% | 82.1% | -0.0 | #51 |
| 63 | 6.03 |  Matas Buzelis PF/SFCHI | 16.3 | 5.8 | 2.1 | 0.7 | 1.5 | 2.2 | 46.3% | 78.6% | -0.1 | #66 |
| 64 | 6.04 | Paolo Banchero PFORL | 22.2 | 8.4 | 5.2 | 0.7 | 0.6 | 1.2 | 45.9% | 77.5% | -0.2 | #111 |
| 65 | 6.05 |  Jaden McDaniels SF/PFMIN | 14.8 | 4.2 | 2.7 | 1.1 | 1.0 | 1.4 | 51.5% | 83.5% | -0.2 | #61 |
| 66 | 6.06 | Jrue Holiday PG/SGPORDTD | 16.3 | 4.6 | 6.1 | 1.0 | 0.1 | 2.6 | 45.1% | 83.8% | -0.2 | #101 |
| 67 | 6.07 |  Andrew Wiggins SF/SG/PFMIA | 15.4 | 4.8 | 2.7 | 1.1 | 1.0 | 2.0 | 47.5% | 78.4% | -0.2 | #58 |
| 68 | 6.08 | Ja Morant PG/SGPOR | 19.4 | 3.3 | 8.1 | 1.0 | 0.3 | 1.0 | 41.0% | 89.7% | -0.3 | #147 |
| 69 | 6.09 |  Norman Powell SF/SGCHI | 21.7 | 3.5 | 2.5 | 1.1 | 0.2 | 2.7 | 47.0% | 82.7% | -0.3 | #69 |
| 70 | 6.10 |  Kyshawn George SF/SGWAS | 14.8 | 5.1 | 4.5 | 1.0 | 0.9 | 2.1 | 43.8% | 80.2% | -0.5 | #100 |
| 71 | 6.11 |  Nikola Vučević CORL | 15.1 | 8.4 | 3.3 | 0.6 | 0.6 | 1.6 | 49.3% | 82.8% | -0.5 | #57 |
| 72 | 6.12 |  Josh Hart SG/SFNYKDTD | 12.0 | 7.4 | 4.8 | 1.1 | 0.3 | 1.5 | 50.8% | 72.0% | -0.5 | #76 |
| 73 | 7.01 |  Jarrett Allen CCLE | 15.4 | 8.5 | 1.8 | 1.0 | 0.8 | 0.0 | 63.8% | 70.9% | -0.6 | #55 |
| 74 | 7.02 |  Jalen Williams PF/SG/SFOKC | 17.1 | 4.6 | 5.5 | 1.2 | 0.3 | 0.7 | 48.4% | 83.7% | -0.6 | #83 |
| 75 | 7.03 |  Pascal Siakam PF/CIND | 24.0 | 6.6 | 3.8 | 1.1 | 0.4 | 1.7 | 48.4% | 69.3% | -0.7 | #92 |
| 76 | 7.04 |  Reed Sheppard PG/SGHOU | 13.5 | 2.9 | 3.4 | 1.5 | 0.7 | 2.8 | 43.0% | 80.2% | -0.7 | #65 |
| 77 | 7.05 |  Franz Wagner SF/PFORLDTD | 20.6 | 5.2 | 3.3 | 0.9 | 0.3 | 1.4 | 48.1% | 82.3% | -0.8 | #75 |
| 78 | 7.06 | Stephon Castle SG/PGSAS | 16.7 | 5.3 | 7.4 | 1.1 | 0.3 | 1.2 | 47.1% | 73.4% | -0.8 | #149 |
| 79 | 7.07 |  Grayson Allen SF/SGCHADTD | 16.5 | 3.0 | 3.8 | 1.4 | 0.3 | 3.1 | 40.3% | 85.7% | -0.9 | #79 |
| 80 | 7.08 |  Naz Reid C/PFCHA | 13.6 | 6.2 | 2.2 | 1.0 | 1.0 | 2.1 | 45.6% | 73.2% | -1.0 | #85 |
| 81 | 7.09 |  Payton Pritchard PG/SGBOS | 17.0 | 3.9 | 5.2 | 0.7 | 0.1 | 2.7 | 46.4% | 89.0% | -1.0 | #70 |
| 82 | 7.10 |  Collin Gillespie PG/SGPHX | 12.7 | 4.1 | 4.6 | 1.2 | 0.2 | 2.9 | 41.8% | 87.4% | -1.1 | #86 |
| 83 | 7.11 | Jusuf Nurkić CUTAOUT | 10.9 | 10.4 | 4.8 | 1.3 | 0.5 | 0.6 | 50.3% | 54.9% | -1.1 | #115 |
| 84 | 7.12 |  Neemias Queta CBOS | 10.2 | 8.4 | 1.7 | 0.8 | 1.3 | 0.0 | 65.3% | 70.3% | -1.1 | #59 |
| 85 | 8.01 |  Tre Jones SG/PG/SFCHI | 14.1 | 3.1 | 5.4 | 1.2 | 0.2 | 0.6 | 55.3% | 84.1% | -1.2 | #74 |
| 86 | 8.02 |  Kel'el Ware C/PFMIL | 11.1 | 9.0 | 0.7 | 0.8 | 1.1 | 1.2 | 53.0% | 74.0% | -1.2 | #52 |
| 87 | 8.03 | Shaedon Sharpe SG/PGPOROUT | 20.8 | 4.3 | 2.6 | 1.4 | 0.1 | 2.1 | 45.2% | 78.7% | -1.2 | #156 |
| 88 | 8.04 |  Ausar Thompson SG/SFDET | 9.9 | 5.7 | 3.1 | 2.0 | 0.9 | 0.1 | 52.5% | 57.1% | -1.2 | #84 |
| 89 | 8.05 | Andrew Nembhard PG/SGIND | 16.9 | 2.8 | 7.7 | 0.9 | 0.1 | 1.9 | 44.2% | 82.5% | -1.3 | #125 |
| 90 | 8.06 |  DeMar DeRozan SF/SG/PFDEN | 18.4 | 2.9 | 4.1 | 1.0 | 0.3 | 0.6 | 49.7% | 86.8% | -1.3 | #72 |
| 91 | 8.07 |  Zion Williamson PF/SFNOP | 21.0 | 5.7 | 3.2 | 1.0 | 0.5 | 0.0 | 60.0% | 71.6% | -1.3 | #102 |
| 92 | 8.08 |  Kristaps Porziņģis CGSWOUT | 16.7 | 5.2 | 2.5 | 0.6 | 1.2 | 1.7 | 44.6% | 84.2% | -1.3 | #73 |
| 93 | 8.09 |  Jabari Smith PF/CHOU | 15.8 | 6.9 | 1.9 | 0.7 | 0.9 | 2.3 | 45.0% | 77.5% | -1.3 | #80 |
| 94 | 8.10 |  Mark Williams CPHXOUT | 11.7 | 8.0 | 1.0 | 0.9 | 0.9 | 0.0 | 64.4% | 77.1% | -1.3 | #64 |
| 95 | 8.11 | 9.2 | 9.4 | 3.5 | 1.0 | 0.8 | 0.0 | 62.2% | 61.0% | -1.4 | #89 | |
| 96 | 8.12 |  Rudy Gobert CMIN | 10.9 | 11.5 | 1.7 | 0.8 | 1.6 | 0.0 | 68.2% | 52.6% | -1.4 | #77 |
| 97 | 9.01 |  Ivica Zubac CIND | 14.1 | 10.6 | 2.2 | 0.4 | 0.8 | 0.0 | 59.8% | 71.1% | -1.5 | #94 |
| 98 | 9.02 | Derik Queen C/PFNOP | 11.7 | 7.1 | 3.7 | 1.0 | 0.9 | 0.3 | 47.3% | 79.5% | -1.6 | #130 |
| 99 | 9.03 |  Keegan Murray PF/SFSAC | 14.0 | 5.7 | 1.7 | 1.0 | 1.6 | 1.3 | 42.0% | 77.6% | -1.6 | #82 |
| 100 | 9.04 |  Donte DiVincenzo SG/SFMINOUT | 12.2 | 4.1 | 3.8 | 1.3 | 0.4 | 3.0 | 40.6% | 74.3% | -1.6 | #88 |
| 101 | 9.05 |  Anthony Black SG/PG/SFORLDTD | 15.0 | 3.8 | 3.7 | 1.4 | 0.7 | 1.6 | 44.7% | 73.2% | -1.7 | #123 |
| 102 | 9.06 |  Ayo Dosunmu SG/PGMIN | 14.8 | 3.4 | 3.6 | 0.8 | 0.3 | 1.8 | 51.7% | 87.6% | -1.8 | #93 |
| 103 | 9.07 |  Zach LaVine SG/SFSAC | 19.2 | 2.8 | 2.3 | 0.7 | 0.3 | 2.5 | 47.9% | 88.0% | -1.8 | #119 |
| 104 | 9.08 |  Saddiq Bey SF/PFNOP | 17.7 | 5.6 | 2.5 | 0.9 | 0.1 | 2.1 | 45.1% | 84.1% | -1.8 | #81 |
| 105 | 9.09 |  CJ McCollum PG/SGATL | 18.7 | 3.3 | 3.9 | 0.8 | 0.5 | 2.5 | 45.5% | 77.2% | -1.8 | #113 |
| 106 | 9.10 |  Peyton Watson SF/PFCLE | 14.6 | 4.9 | 2.1 | 0.9 | 1.1 | 1.5 | 49.1% | 73.0% | -1.9 | #108 |
| 107 | 9.11 |  Ajay Mitchell PG/SGOKC | 13.6 | 3.3 | 3.6 | 1.2 | 0.3 | 1.1 | 48.5% | 87.0% | -1.9 | #97 |
| 108 | 9.12 |  Kelly Oubre PF/SFIND | 14.1 | 5.0 | 1.6 | 1.4 | 0.5 | 1.7 | 46.7% | 76.6% | -2.0 | #96 |
| 109 | 10.01 |  Myles Turner CMIL | 11.9 | 5.3 | 1.5 | 0.7 | 1.6 | 2.1 | 44.0% | 74.0% | -2.0 | #87 |
| 110 | 10.02 |  Toumani Camara SF/SG/PFPOR | 13.4 | 5.1 | 2.5 | 1.1 | 0.4 | 2.7 | 44.0% | 70.8% | -2.0 | #118 |
| 111 | 10.03 |  Miles Bridges PF/SFPHX | 17.1 | 5.8 | 3.2 | 0.6 | 0.4 | 1.9 | 46.0% | 82.2% | -2.0 | #103 |
| 112 | 10.04 |  Brandin Podziemski PG/SGGSW | 13.8 | 5.1 | 3.7 | 1.1 | 0.2 | 1.9 | 45.5% | 79.7% | -2.1 | #114 |
| 113 | 10.05 |  John Collins PF/CDET | 13.6 | 5.3 | 1.0 | 0.9 | 0.7 | 1.3 | 55.2% | 76.6% | -2.1 | #104 |
| 114 | 10.06 |  Jerami Grant PF/SFMEMDTD | 18.6 | 3.5 | 2.1 | 0.7 | 0.6 | 2.4 | 45.3% | 81.4% | -2.2 | #144 |
| 115 | 10.07 |  Santi Aldama PF/SFDALDTD | 14.0 | 6.7 | 2.9 | 0.9 | 0.7 | 1.6 | 47.9% | 66.7% | -2.2 | #98 |
| 116 | 10.08 |  Deandre Ayton CWAS | 12.5 | 8.0 | 0.8 | 0.6 | 1.0 | 0.0 | 67.1% | 64.5% | -2.2 | #91 |
| 117 | 10.09 |  Cason Wallace SG/PG/SFOKCDTD | 8.6 | 3.1 | 2.6 | 1.9 | 0.4 | 1.3 | 43.2% | 80.9% | -2.3 | #90 |
| 118 | 10.10 |  Collin Sexton SG/PGLALDTD | 15.4 | 2.3 | 3.3 | 1.1 | 0.1 | 1.6 | 48.5% | 85.5% | -2.3 | #151 |
| 119 | 10.11 |  P.J. Washington PF/SF/CDAL | 14.2 | 7.0 | 1.8 | 1.0 | 1.1 | 1.4 | 45.0% | 68.7% | -2.4 | #128 |
| 120 | 10.12 |  Bennedict Mathurin SF/SGNOP | 17.6 | 5.4 | 2.4 | 0.8 | 0.2 | 1.4 | 43.0% | 86.9% | -2.4 | #160 |
| 121 | 11.01 |  Wendell Carter CORL | 11.8 | 7.4 | 2.0 | 0.8 | 0.6 | 0.9 | 51.2% | 79.2% | -2.5 | #107 |
| 122 | 11.02 |  Cam Spencer SG/PG/SFMEM | 11.1 | 2.5 | 5.6 | 0.7 | 0.2 | 2.0 | 47.3% | 94.0% | -2.6 | #117 |
| 123 | 11.03 |  Jakob Poeltl CTOR | 10.7 | 7.0 | 2.0 | 0.9 | 0.7 | 0.0 | 70.0% | 60.2% | -2.6 | #109 |
| 124 | 11.04 |  Royce O'Neale PF/SFCHA | 9.8 | 4.8 | 2.7 | 1.1 | 0.4 | 2.7 | 42.1% | 71.1% | -2.6 | #120 |
| 125 | 11.05 |  Tobias Harris PFSASDTD | 13.3 | 5.1 | 2.5 | 0.9 | 0.4 | 1.3 | 46.9% | 86.6% | -2.6 | #106 |
| 126 | 11.06 |  Jay Huff CIND | 9.5 | 4.0 | 1.5 | 0.5 | 1.9 | 1.5 | 47.6% | 82.8% | -2.6 | #95 |
| 127 | 11.07 |  Kyle Filipowski C/PFUTADTD | 11.4 | 7.2 | 2.6 | 0.9 | 0.5 | 1.0 | 49.2% | 75.0% | -2.6 | #135 |
| 128 | 11.08 |  Draymond Green PF/CGSW | 8.4 | 5.5 | 5.5 | 0.9 | 0.6 | 1.5 | 41.8% | 70.2% | -2.7 | #189 |
| 129 | 11.09 |  Bilal Coulibaly SF/PFWAS | 11.7 | 4.3 | 2.6 | 1.3 | 1.0 | 1.2 | 42.5% | 74.6% | -2.7 | #129 |
| 130 | 11.10 |  RJ Barrett SF/SG/PFTOR | 19.3 | 5.3 | 3.3 | 0.7 | 0.3 | 1.7 | 49.1% | 71.7% | -2.7 | #146 |
| 131 | 11.11 |  Jaylon Tyson SF/SG/PFCLE | 13.2 | 5.1 | 2.2 | 0.8 | 0.4 | 2.0 | 49.3% | 73.8% | -2.7 | #132 |
| 132 | 11.12 |  Cedric Coward SG/SFMEM | 13.6 | 5.9 | 2.8 | 0.6 | 0.4 | 1.5 | 47.1% | 84.3% | -2.8 | #145 |
| 133 | 12.01 |  Dillon Brooks SF/SG/PFPHX | 20.2 | 3.6 | 1.8 | 1.0 | 0.2 | 2.3 | 43.5% | 84.2% | -2.8 | #155 |
| 134 | 12.02 |  Jaime Jaquez PF/SG/SFMIL | 15.4 | 5.0 | 4.7 | 0.7 | 0.3 | 0.8 | 50.7% | 76.9% | -2.8 | #164 |
| 135 | 12.03 |  De'Anthony Melton SG/PGGSW | 12.3 | 3.2 | 2.6 | 1.6 | 0.4 | 1.5 | 40.7% | 82.6% | -3.0 | #163 |
| 136 | 12.04 |  Robert Williams CPOR | 6.7 | 7.0 | 1.0 | 0.6 | 1.5 | 0.2 | 70.8% | 59.6% | -3.0 | #105 |
| 137 | 12.05 |  Naji Marshall SF/SG/PFDAL | 15.2 | 4.7 | 3.3 | 1.1 | 0.1 | 0.8 | 51.0% | 76.0% | -3.0 | #152 |
| 138 | 12.06 |  Moussa Diabaté CCHADTD | 7.9 | 8.7 | 1.9 | 0.8 | 1.0 | 0.0 | 63.1% | 65.9% | -3.0 | #110 |
| 139 | 12.07 |  Daniel Gafford CDAL | 9.5 | 6.9 | 1.1 | 0.8 | 1.3 | 0.0 | 65.5% | 68.3% | -3.0 | #121 |
| 140 | 12.08 |  Aaron Gordon PF/CDEN | 16.2 | 5.8 | 2.7 | 0.6 | 0.3 | 1.7 | 49.7% | 76.7% | -3.0 | #122 |
| 141 | 12.09 |  Devin Vassell SF/SGSAS | 13.9 | 4.0 | 2.5 | 0.9 | 0.4 | 2.5 | 43.7% | 81.5% | -3.1 | #116 |
| 142 | 12.10 |  Nic Claxton C/PFCHIDTD | 11.7 | 6.9 | 3.7 | 0.7 | 1.1 | 0.0 | 57.1% | 61.6% | -3.1 | #138 |
| 143 | 12.11 |  Julian Champagnie SF/SG/PFSAS | 11.1 | 5.8 | 1.5 | 0.8 | 0.5 | 2.4 | 43.7% | 84.4% | -3.1 | #112 |
| 144 | 12.12 |  Isaiah Collier PGUTA | 11.7 | 2.5 | 7.2 | 1.1 | 0.3 | 0.5 | 49.5% | 72.2% | -3.1 | #201 |
| 145 | 13.01 |  Quentin Grimes SG/SFLAL | 13.4 | 3.6 | 3.3 | 0.9 | 0.4 | 1.7 | 45.0% | 84.0% | -3.2 | #165 |
| 146 | 13.02 |  Kris Dunn SG/PGLAC | 7.3 | 3.3 | 3.6 | 1.6 | 0.2 | 1.0 | 47.6% | 76.5% | -3.3 | #150 |
| 147 | 13.03 |  Cameron Johnson SF/SG/PFDEN | 12.2 | 3.8 | 2.4 | 0.7 | 0.4 | 2.0 | 48.0% | 83.9% | -3.3 | #124 |
| 148 | 13.04 |  Maxime Raynaud CSACOUT | 12.5 | 7.5 | 1.4 | 0.5 | 0.5 | 0.3 | 57.1% | 78.6% | -3.3 | #143 |
| 149 | 13.05 |  Al Horford C/PFGSW | 8.3 | 4.9 | 2.6 | 0.7 | 1.1 | 1.6 | 42.6% | 84.6% | -3.3 | #126 |
| 150 | 13.06 |  Tari Eason SG/SFHOU | 10.4 | 6.3 | 1.5 | 1.2 | 0.5 | 1.6 | 41.6% | 77.6% | -3.3 | #153 |
| 151 | 13.07 |  Jeremiah Fears PG/SGNOP | 14.3 | 3.7 | 3.4 | 1.2 | 0.4 | 1.2 | 43.4% | 78.9% | -3.4 | #195 |
| 152 | 13.08 |  Matisse Thybulle SF/SGLAL | 5.8 | 2.0 | 0.9 | 2.0 | 0.5 | 1.2 | 43.3% | 84.0% | -3.4 | #131 |
| 153 | 13.09 |  Moses Moody SF/SG/PFGSWOUT | 12.1 | 3.3 | 1.6 | 1.0 | 0.6 | 2.5 | 44.0% | 77.0% | -3.4 | #134 |
| 154 | 13.10 |  Sandro Mamukelashvili C/PFLAL | 11.2 | 4.9 | 1.9 | 0.8 | 0.5 | 1.4 | 52.3% | 74.7% | -3.5 | #127 |
| 155 | 13.11 |  Davion Mitchell PGMIA | 9.3 | 2.7 | 6.5 | 1.0 | 0.2 | 1.3 | 49.0% | 64.6% | -3.5 | #167 |
| 156 | 13.12 |  Coby White PG/SGCHADTD | 17.4 | 3.4 | 4.0 | 0.5 | 0.1 | 2.3 | 44.6% | 81.7% | -3.5 | #226 |
| 157 | 14.01 |  Herbert Jones SG/SFNOP | 8.9 | 3.4 | 2.8 | 1.6 | 0.5 | 1.4 | 38.3% | 80.6% | -3.5 | #158 |
| 158 | 14.02 |  Jordan Goodwin SG/SFPHX | 8.7 | 4.9 | 2.2 | 1.5 | 0.2 | 1.6 | 41.3% | 69.6% | -3.6 | #141 |
| 159 | 14.03 |  Jalen Green SG/SFPHX | 17.8 | 3.6 | 2.8 | 1.1 | 0.3 | 2.2 | 42.2% | 74.7% | -3.6 | #212 |
| 160 | 14.04 |  Bobby Portis C/PFMIA | 13.7 | 6.4 | 1.6 | 0.6 | 0.2 | 2.0 | 48.8% | 70.6% | -3.6 | #142 |
| 161 | 14.05 |  Ace Bailey SF/PFUTA | 13.8 | 4.2 | 1.8 | 0.8 | 0.7 | 1.9 | 44.3% | 75.0% | -3.6 | #168 |
| 162 | 14.06 |  Scoot Henderson PGPOR | 14.2 | 2.7 | 3.7 | 0.9 | 0.3 | 1.9 | 41.8% | 84.0% | -3.6 | #227 |
| 163 | 14.07 |  Day'Ron Sharpe CBKN | 8.7 | 6.7 | 2.3 | 1.1 | 0.4 | 0.1 | 60.1% | 67.8% | -3.7 | #179 |
| 164 | 14.08 |  Ryan Kalkbrenner CCHA | 7.6 | 5.5 | 0.8 | 0.5 | 1.5 | 0.0 | 75.3% | 71.6% | -3.7 | #136 |
| 165 | 14.09 |  Marcus Smart SG/PG/SFHOU | 9.3 | 2.8 | 3.0 | 1.4 | 0.4 | 1.6 | 39.5% | 82.2% | -3.8 | #175 |
| 166 | 14.10 |  Isaiah Stewart C/PFMEMOUT | 10.0 | 5.0 | 1.1 | 0.3 | 1.6 | 0.7 | 55.0% | 75.6% | -3.8 | #157 |
| 167 | 14.11 |  Dylan Cardwell C/PFSACOUT | 5.4 | 7.5 | 1.4 | 0.7 | 1.5 | 0.0 | 58.7% | 51.0% | -3.8 | #139 |
| 168 | 14.12 |  Derrick Jones PF/SFLAC | 10.1 | 3.5 | 1.4 | 0.9 | 1.0 | 1.1 | 49.9% | 76.3% | -3.8 | #140 |
| 169 | 15.01 |  Sam Merrill SG/SFCLEDTD | 12.8 | 2.6 | 2.4 | 0.6 | 0.1 | 3.0 | 46.1% | 85.5% | -3.9 | #148 |
| 170 | 15.02 | 5.7 | 8.8 | 0.9 | 0.9 | 1.2 | 0.0 | 72.3% | 40.8% | -3.9 | #133 | |
| 171 | 15.03 |  Jalen Smith C/PFCHI | 10.2 | 6.7 | 1.2 | 0.5 | 0.8 | 1.5 | 48.3% | 74.2% | -4.0 | #159 |
| 172 | 15.04 |  Collin Murray-Boyles C/PFTOR | 8.5 | 5.0 | 1.9 | 0.9 | 0.9 | 0.3 | 57.9% | 65.7% | -4.0 | #161 |
| 173 | 15.05 |  T.J. McConnell PGINDDTD | 9.4 | 2.2 | 5.1 | 1.0 | 0.2 | 0.3 | 53.8% | 86.2% | -4.1 | #169 |
| 174 | 15.06 |  Christian Braun SG/SFDEN | 12.0 | 4.8 | 2.7 | 0.7 | 0.3 | 1.0 | 51.9% | 78.2% | -4.1 | #162 |
| 175 | 15.07 |  Dylan Harper SG/PGSAS | 11.8 | 3.4 | 3.9 | 0.8 | 0.3 | 0.9 | 50.5% | 75.6% | -4.1 | #186 |
| 176 | 15.08 |  Max Christie SG/SFDAL | 12.3 | 3.2 | 2.0 | 0.6 | 0.4 | 2.3 | 44.1% | 89.9% | -4.2 | #180 |
| 177 | 15.09 |  Brice Sensabaugh SF/SG/PFUTA | 14.9 | 3.1 | 1.9 | 0.7 | 0.2 | 2.2 | 46.0% | 82.6% | -4.2 | #204 |
| 178 | 15.10 |  Ziaire Williams SF/SGLAL | 10.2 | 2.4 | 1.1 | 1.4 | 0.4 | 1.5 | 42.5% | 85.0% | -4.3 | #174 |
| 179 | 15.11 |  Aaron Nesmith SF/SGINDDTD | 13.8 | 4.2 | 1.9 | 0.6 | 0.5 | 2.3 | 41.4% | 82.9% | -4.3 | #190 |
| 180 | 15.12 |  Egor Dëmin SG/PGBKN | 10.3 | 3.2 | 3.3 | 0.8 | 0.3 | 2.4 | 39.9% | 83.1% | -4.3 | #209 |
| 181 | 16.01 |  Justin Champagnie PFWAS | 8.7 | 5.6 | 1.2 | 0.9 | 0.6 | 0.8 | 50.2% | 78.4% | -4.3 | #154 |
| 182 | 16.02 |  Javon Small PG/SGMEM | 9.7 | 3.1 | 3.7 | 0.8 | 0.2 | 1.5 | 46.5% | 82.9% | -4.4 | #191 |
| 183 | 16.03 |  Luke Kornet CSAS | 6.5 | 6.1 | 1.9 | 0.5 | 1.0 | 0.0 | 64.3% | 82.5% | -4.4 | #137 |
| 184 | 16.04 |  Miles McBride SG/PGNYK | 12.0 | 2.4 | 2.6 | 0.9 | 0.2 | 2.7 | 42.3% | 78.7% | -4.4 | #166 |
| 185 | 16.05 |  Jake LaRavia SF/SGLAL | 8.2 | 4.0 | 1.8 | 1.3 | 0.5 | 1.0 | 45.9% | 76.3% | -4.4 | #177 |
| 186 | 16.06 |  Obi Toppin PF/SFIND | 11.6 | 4.4 | 2.3 | 0.5 | 0.0 | 1.5 | 50.3% | 91.3% | -4.4 | #183 |
| 187 | 16.07 |  Kevin Huerter SG/SFDET | 10.0 | 3.5 | 2.6 | 0.9 | 0.5 | 1.4 | 45.1% | 77.5% | -4.4 | #178 |
| 188 | 16.08 |  Kyle Kuzma PF/SFMIL | 13.0 | 4.5 | 2.7 | 0.7 | 0.4 | 1.2 | 49.2% | 72.6% | -4.4 | #216 |
| 189 | 16.09 |  Brandon Williams PGGSW | 13.0 | 2.9 | 3.9 | 0.9 | 0.3 | 0.5 | 47.2% | 79.3% | -4.5 | #233 |
| 190 | 16.10 | 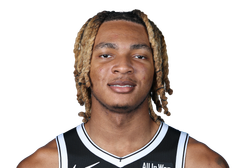 Noah Clowney PF/CBKN | 12.3 | 4.1 | 1.6 | 0.8 | 0.7 | 2.0 | 39.6% | 80.4% | -4.5 | #206 |
| 191 | 16.11 | 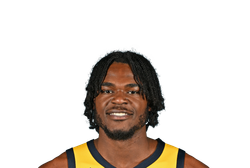 Jarace Walker PF/SFINDDTD | 11.6 | 5.1 | 2.5 | 0.8 | 0.3 | 1.8 | 41.9% | 74.9% | -4.5 | #229 |
| 192 | 16.12 | 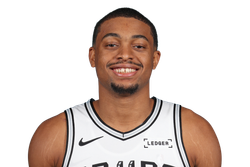 Keldon Johnson PF/SFSAS | 13.2 | 5.4 | 1.4 | 0.6 | 0.1 | 1.2 | 51.9% | 79.4% | -4.6 | #172 |
| 193 | 17.01 |  Paul Reed C/PFDET | 7.8 | 4.5 | 1.2 | 0.9 | 0.9 | 0.2 | 61.7% | 66.4% | -4.6 | #173 |
| 194 | 17.02 | 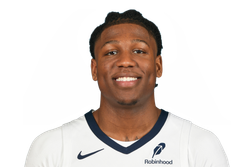 GG Jackson PF/SFMEMDTD | 12.5 | 4.3 | 1.5 | 0.6 | 0.8 | 1.2 | 49.6% | 74.2% | -4.6 | #211 |
| 195 | 17.03 |  Precious Achiuwa PF/CSAC | 10.1 | 6.7 | 1.4 | 0.9 | 0.7 | 0.4 | 52.8% | 55.4% | -4.6 | #176 |
| 196 | 17.04 |  Duncan Robinson SF/SGDET | 12.2 | 2.7 | 2.1 | 0.6 | 0.3 | 2.9 | 45.6% | 75.5% | -4.6 | #171 |
| 197 | 17.05 |  Marvin Bagley CDEN | 10.4 | 6.1 | 1.4 | 0.5 | 0.7 | 0.4 | 61.8% | 66.0% | -4.7 | #182 |
| 198 | 17.06 |  Bub Carrington PG/SGWAS | 10.7 | 3.4 | 4.6 | 0.6 | 0.2 | 2.1 | 42.4% | 73.0% | -4.7 | #261 |
| 199 | 17.07 |  Tristan da Silva SF/PFORL | 9.9 | 3.7 | 1.6 | 0.9 | 0.3 | 1.6 | 45.0% | 88.4% | -4.7 | #181 |
| 200 | 17.08 |  Anfernee Simons PG/SGPHIDTD | 14.3 | 2.5 | 2.4 | 0.5 | 0.1 | 2.7 | 44.0% | 89.6% | -4.7 | #203 |


Per-game lines; value is the sum of the eight category z-scores. Rd is where the rank lands in a 12-team draft. The last column is his rank on the standard 9-cat board, so the gap is what turnovers cost him there. Showing the top 200.
Common questions
What is an 8-cat fantasy basketball league?
The standard nine categories without turnovers: points, rebounds, assists, steals, blocks, threes, field goal percentage and free throw percentage. Players who handle the ball a lot stop paying for their turnovers.
Who are the top 8-cat players for 2026-27?
Nikola Jokić (+13.1), Victor Wembanyama (+10.3) and Luka Dončić (+9.1) on our board.
How different is 8-cat from 9-cat?
The biggest climber in the top 100 is Ja Morant, No. 147 in 9-cat and No. 68 in 8-cat, because his 3.5 turnovers a game no longer count against him. 10 players in the top 100 climb five places or more.
How is the 8-cat value worked out?
Each of the eight categories is a z-score against the top 156 players, chosen by the eight-category value itself, so the pool is the one an 8-cat league rosters. Percentages are weighted by attempts. The eight are added up.
By the Parlae deskBoard updated Oct 18, 2026 at 10:26 PM ETHow this is builtReport a wrong number