Trade Braelon Allen for Chris Olave? Yes, Olave is worth 28 more.
Yes on value. Chris Olave is worth 81 rest of season and Braelon Allen 53, so the side getting Olave gains 28. Allen rates 13.7 market points a game with 10 games left, Olave 17.2 with 10. On usage, Allen has 49 percent of NYJ carries and 8 percent of its targets; Olave has drawn 27 percent of NO targets. Allen hosts MIA in Week 7 (4th most points allowed to RBs); Olave hosts PIT in Week 7 (6th fewest points allowed to WRs). Neither carries an injury designation this week.
The verdict, Week 7
Advertisement
Run this trade in the analyzer
Both sides are filled in. Add a player to either side to check a two for one.
In a dynasty league? Run it in the dynasty trade calculator.
Parlae may earn a commission from price links.
- Pts/game
- 13.7
- Games left
- 10
- Bye
- 13
| Wk 3 | Wk 4 | Wk 5 | Wk 6 | Wk 7 |
|---|---|---|---|---|
| no projection | no projection | 13.7 | 14.5 | 8.6 |
- Pts/game
- 17.2
- Games left
- 10
- Bye
- 8
| Wk 3 | Wk 4 | Wk 5 | Wk 6 | Wk 7 |
|---|---|---|---|---|
| 17.3 | 19.4 | 16.9 | 17.2 | 15.4 |
Where the values come from
Allen is the 16th running back on the chart and 32nd overall. His 13.7 a game is 5.3 above the replacement running back's 8.4, over 10 games left with his bye in Week 13, which is how he comes to 53.
Olave is the 6th receiver on the chart and 13th overall. His 17.2 a game is 8.1 above the replacement receiver's 9.1, over 10 games left with his bye in Week 8, which is how he comes to 81.
The weekly projections
Parlae's market-based projections had Braelon Allen at 13.7 in Week 5, 14.5 in Week 6 and 8.6 in Week 7, a median of 13.7 points a game, down 5.1 from his first frozen week to his latest.
Parlae's market-based projections had Chris Olave at 17.3 in Week 3, 19.4 in Week 4, 16.9 in Week 5, 17.2 in Week 6 and 15.4 in Week 7, a median of 17.2 points a game, down 1.9 from his first frozen week to his latest.
Advertisement
Points so far against the price
Braelon Allen has scored 56.9 PPR points in 6 games, 9.5 a game, 4.2 a game less than the 13.7 he is projected for from here.
Last season he finished RB100 with 15.3 PPR points in 4 games, 3.8 a game.
Week 1 vs TEN: 4.0 points (RB50 that week), 40 rushing yards on 10 carries, 0 of 1 target for 0 yards, 40 percent of snaps.
Week 2 vs GB: 8.5 points (RB32 that week), 7 rushing yards on 5 carries, 1 of 1 target for 8 yards, 1 touchdown, 31 percent of snaps.
Week 3 vs DET: 4.7 points (RB45 that week), 14 rushing yards on 4 carries, 3 of 3 targets for 3 yards, 52 percent of snaps.
Week 4 vs CHI: 8.7 points (RB33 that week), 59 rushing yards on 14 carries, 2 of 2 targets for 8 yards, 94 percent of snaps.
Week 5 vs CLE: 18.6 points (RB8 that week), 116 rushing yards on 24 carries, 1 of 4 targets for 0 yards, 1 touchdown, 86 percent of snaps.
Week 6 vs NE: 12.4 points (RB18 that week), 78 rushing yards on 17 carries, 2 of 2 targets for 26 yards, 87 percent of snaps.
Chris Olave has scored 113.0 PPR points in 6 games, 18.8 a game, 1.6 a game more than the 17.2 he is projected for from here.
Last season he finished WR6 with 269.0 PPR points in 16 games, 16.8 a game.
Week 1 vs DET: 28.2 points (WR5 that week), 10 of 13 targets for 182 yards, 86 percent of snaps.
Week 2 vs BAL: 22.6 points (WR8 that week), 8 of 10 targets for 86 yards, 1 touchdown, 84 percent of snaps.
Week 3 vs LV: 19.7 points (WR14 that week), 9 of 13 targets for 107 yards, 84 percent of snaps.
Week 4 vs ATL: 19.6 points (WR12 that week), 8 of 12 targets for 116 yards, 86 percent of snaps.
Week 5 vs MIN: 8.6 points (WR42 that week), 4 of 6 targets for 46 yards, 91 percent of snaps.
Week 6 vs NYG: 14.3 points (WR22 that week), 4 of 7 targets for 43 yards, 1 touchdown, 58 percent of snaps.
Usage a game this season
Through Week 6, Braelon Allen has averaged 12.3 carries for 52 yards and 2.2 targets and 1-2 catches for 8 yards a game on 61 percent of the snaps.
He has been targeted or handed the ball 10 times inside the 20, 29 percent of his team's chances there, and has scored 2 touchdowns in 6 games.
In Week 6 against NE he had 17 carries and 2 targets on 87 percent of the snaps.
Through Week 6, Chris Olave has averaged 10.2 targets and 7.2 catches for 97 yards a game on 81 percent of the snaps.
He has been targeted or handed the ball 6 times inside the 20, 11 percent of his team's chances there, and has scored 2 touchdowns in 6 games.
In Week 6 against NYG he had 7 targets on 58 percent of the snaps.
Schedule and next matchup
A trade made now buys Week 7 through Week 17. Braelon Allen has 10 games in it with his bye in Week 13; Chris Olave has 10 games with his bye in Week 8.
MIA, Allen's Week 7 opponent, has allowed 26.1 PPR points a game to RBs this season over 5 games, the 4th most to RBs of 32.
PIT, Olave's Week 7 opponent, has allowed 28.6 PPR points a game to WRs this season over 6 games, the 6th fewest to WRs of 32.
What would even it
The side getting Braelon Allen would want about 28 more added to make it even: a player like Tyler Warren, valued at 29. Two players for Olave also costs that side a roster spot.
Other trades for Braelon Allen and Chris Olave
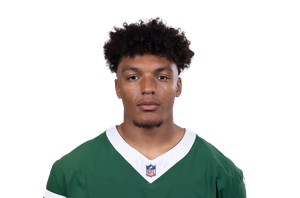
 Braelon Allen for Trey McBride53 vs 75
 Braelon Allen for Brock Bowers53 vs 74
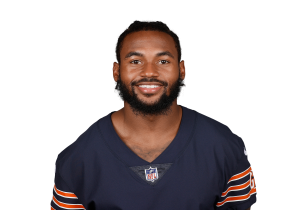 Braelon Allen for D'Andre Swift53 vs 73
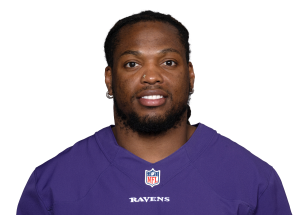 Braelon Allen for Derrick Henry53 vs 72
 Braelon Allen for Garrett Wilson53 vs 70
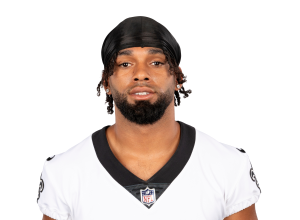
 Chris Olave for Jaxon Smith-Njigba81 vs 108
 Chris Olave for Jonathan Taylor81 vs 104
 Chris Olave for Ja'Marr Chase81 vs 99
 CeeDee Lamb for Chris Olave91 vs 81
 Chris Olave for Kyren Williams81 vs 90
The full Week 7 trade value chart
Week 7 on the board
- Is Braelon Allen playing Week 7?
- Is Chris Olave playing Week 7?
- Jets depth chart
- Saints depth chart
- Week 7 RB rankings
- Week 7 WR rankings
- Week 7 fantasy rankings
- Week 7 start or sit
- Week 7 waiver wire
- Week 7 trade value chart
- Trade deadline buy low, sell high
- Fantasy football rankings
- Start 'em sit 'em Week 7
- Waiver wire pickups
- Fantasy sleepers
- Rest of season rankings
- Week 7 kicker rankings
- Week 7 defense rankings
Common questions
Should I trade Braelon Allen for Chris Olave?
Yes on value: Chris Olave is worth 81 and Braelon Allen 53, a gain of 28. If Braelon Allen starts for you and Chris Olave would sit, check the lineup first in the trade analyzer.
Who has more rest-of-season value, Braelon Allen or Chris Olave?
Chris Olave, 81 to 53. He rates 17.2 market points a game over 10 games left, against 13.7 over 10 for Braelon Allen, each measured above a replacement starter at his own position.
How are these trade values calculated?
Each player's points per game is the median of the market-based PPR points we froze before each week's first kickoff, Weeks 3, 4, 5, 6, 7. A replacement starter's rate is subtracted and the rest is multiplied by his games from Week 7 to Week 17, bye taken out. No expert opinion is involved.
By the Parlae deskValues updated Oct 21, 2026 at 8:16 PM ETHow this is builtReport a wrong number