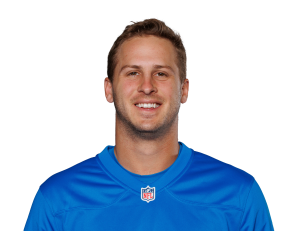
Should I start T.J. Hockenson or Cade Otton in Week 7?
Updated Oct 22, 2:36 PM ET. Week 8 answers post Tuesday.
Week 7 verdict
Start T.J. Hockenson over Cade Otton

- Market projects
- 9.9
- fantasy pts
- IND D vs TE
- 13.3
- 15th most to TEs (2026)
- Snap share
- 60%
- Through Week 5
- Target share
- 21%
- Through Week 5
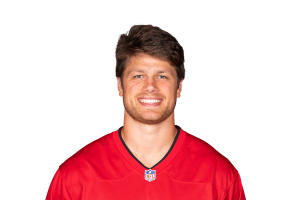
- Market projects
- 9.4
- fantasy pts
- CAR D vs TE
- 16.0
- 9th most to TEs (2026)
- Snap share
- 95%
- Through Week 6
- Target share
- 16%
- Through Week 6
Start T.J. Hockenson: his market-based projection is 0.6 points a game ahead of Cade Otton's this season.
Parlae may earn a commission from price links.
Advertisement
Your next move
More fantasy football tools and rankings, all built from the same board.
Both players' season market-based projection, their usage this season and their last full season's numbers.
TE11 · MIN · bye 6
2026 vs anytime td line 1-4
- Market-based projection
- 9.9 pts a game
TE12 · TB · bye 10
2026 vs anytime td line 0-6
- Market-based projection
- 9.3 pts a game
Make this call for your own roster
Sync your league and My Team sets this week's lineup for your actual roster, spot by spot. Free, no account.
Or get it by email
Tuesday 8am ET: one email with what moved on the board and who is worth a claim.
Free. One a week, one tap to stop.
The gap
- Price difference0.6 points a game
- Board size317 draftable players
Draft data is not current for these two, so the figures that depend on it are left out. The call above comes from the market projection.
The market-based projections
T.J. Hockenson's market-based projection is 9.9 PPR points a game, built from 3 markets across 12 market sources. That is the 88th highest figure of the 216 players with a market-based projection.
Cade Otton's market-based projection is 9.3 PPR points a game, built from 3 markets across 13 market sources. That is the 92nd highest figure of the 216 players with a market-based projection.
Where the draft room stands
Live drafts hold no current pick on T.J. Hockenson, and the board ranks him 79th overall on the rest of his evidence.
Live drafts hold no current pick on Cade Otton, and the board ranks him 88th overall on the rest of his evidence.
This season so far
Through Week 5, T.J. Hockenson has been on the field for 60 percent of MIN snaps, drawn 21 percent of the targets and had 15 percent of the red zone chances.
He has taken 10 of the offence's 51 third down targets, had 0 of its 2 chances inside the five and seen 3 of its 13 two minute targets.
His 27 targets have averaged 6.6 air yards.
In Week 3 against TB he caught 2 of 4 targets for 11 yards and did not score.
In Week 4 against MIA he caught 13 of 13 targets for 119 yards and did not score.
In Week 5 against NO he caught 1 of 1 target for 7 yards and did not score.
Through Week 6, Cade Otton has been on the field for 95 percent of TB snaps, drawn 16 percent of the targets and had 4 percent of the red zone chances.
He has taken 6 of the offence's 53 third down targets, had 0 of its 7 chances inside the five and seen 6 of its 41 two minute targets.
His 29 targets have averaged 6.2 air yards.
In Week 4 against GB he caught 4 of 6 targets for 37 yards and did not score.
In Week 5 against DAL he caught 3 of 4 targets for 25 yards and did not score.
In Week 6 against PIT he caught 1 of 2 targets for 4 yards and did not score.
Their 2025 seasons
In 2025 T.J. Hockenson played 15 games and scored 112.8 PPR points, 7.5 a game, finishing TE26.
He caught 51 of 66 targets for 438 yards and 3 touchdowns, with 11 red zone targets.
That came to 4.4 targets a game, a 77 percent catch rate and 8.6 yards a catch.
He was on the field for 79 percent of the snaps in the games he played.
In 2025 Cade Otton played 16 games and scored 122.2 PPR points, 7.6 a game, finishing TE22.
He caught 59 of 81 targets for 572 yards and 1 touchdown, with 5 red zone targets.
That came to 5.1 targets a game, a 73 percent catch rate and 9.7 yards a catch.
He was on the field for 93 percent of the snaps in the games he played.
Cade Otton was available for 1 game more.
Head to head
In 2025 Cade Otton scored 7.6 PPR points a game and T.J. Hockenson 7.5, 0.1 a game between them.
T.J. Hockenson finished TE26 that year and Cade Otton TE22.
Cade Otton had 15 more targets than T.J. Hockenson, 81 to 66.
Cade Otton had 134 more receiving yards than T.J. Hockenson, 572 to 438.
This season Cade Otton holds the bigger snap share, 95 percent against 60 percent.
This season T.J. Hockenson holds the bigger target share, 21 percent against 16 percent.
Byes and availability
T.J. Hockenson is off in Week 6 and Cade Otton in Week 10, so either can cover the other's bye.
T.J. Hockenson is listed as questionable on the injury report.
What would change the answer
0.6 points a game is the entire case. The market restates it every week, and a line that moves moves the order with it.
The draft market is the half that is missing: when live drafts hold these two again they can order them differently from the projection, and this page will follow the drafts rather than the market-based projection when they do.
Both players in full
Week 7 on the board
- Is T.J. Hockenson playing Week 7?
- Is Cade Otton playing Week 7?
- Vikings depth chart
- Buccaneers depth chart
- Week 7 TE rankings
- Week 7 fantasy rankings
- Week 7 start or sit
- Week 7 waiver wire
- Week 7 trade value chart
- Trade deadline buy low, sell high
- Fantasy football rankings
- Start 'em sit 'em Week 7
- Waiver wire pickups
- Fantasy sleepers
- Rest of season rankings
- Week 7 kicker rankings
- Week 7 defense rankings